
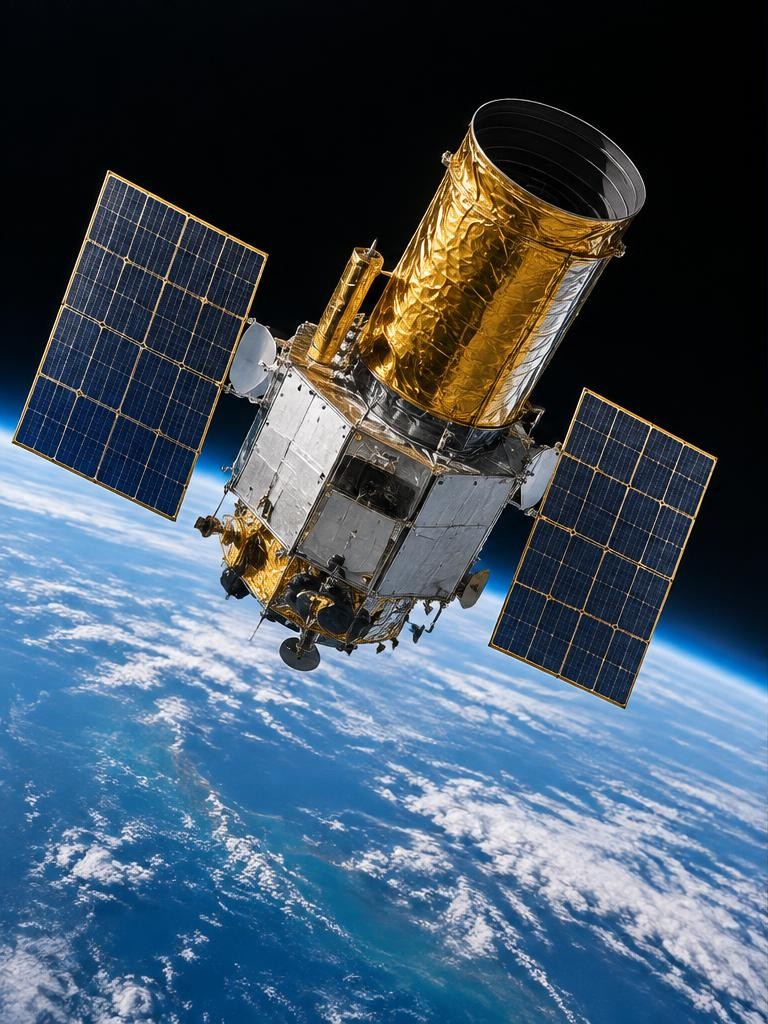
Space photography helped astronomers by recording faint objects, resolving fine detail above much of Earth’s atmosphere, and observing wavelengths that the atmosphere absorbs. Repeated images reveal motion and brightness changes; filtered images reveal differences that our eyes cannot see. These observations support measurements of stars, galaxies, dust, and cosmic history. The important point is not simply that space pictures look clearer. They are calibrated data that scientists compare, measure, and test against models. Ground-based observatories remain essential partners, and not every astronomical discovery comes from an image: spectroscopy and other methods often provide the missing evidence.
011. Start with the problem of Earth’s atmosphere
Moving air distorts incoming starlight, helping explain why stars appear to twinkle and why fine details can blur. The atmosphere also absorbs much radiation outside the visible band.
Space observatories avoid many of these limitations, although their performance still depends on mirrors, detectors, wavelength, and instrument design. NASA describes Hubble’s position above the light-distorting atmosphere and its complementary relationship with Webb.
This does not mean ground telescopes are obsolete: they can use large apertures, adaptive optics, and instruments that are easier to upgrade, while contributing observations unavailable from a single space mission.
022. Understand that detectors count incoming light
A digital astronomical detector records a signal related to arriving photons. Scientists then correct for instrumental effects so the recorded values can support measurements.
Longer observations can make faint sources easier to detect, but simply leaving a shutter open indefinitely is not a complete solution. Background light, detector noise, saturation, spacecraft constraints, and changing conditions must be considered.
Multiple exposures can be aligned and combined while identifying some unwanted events. The resulting image is therefore both a picture and a measurement surface: the brightness and position of a feature carry information, provided the data have been processed and interpreted appropriately.
033. Use deep exposures to study faint galaxies
The Hubble Deep Field demonstrated the scientific value of spending substantial observing time on a seemingly unremarkable patch of sky. NASA describes the 1995 observations as taking place over ten days and revealing roughly 3,000 distant galaxies.
The lesson is not that every dark patch contains the same number of galaxies. Rather, faint objects become accessible when enough useful signal is collected.
Astronomers can study their numbers, colours, shapes, and distributions, while accounting for which objects the observations are sensitive enough to detect and which remain below the detection threshold.
044. Connect distance with a view into the past
Light takes time to travel, so observations of distant objects show them as they were when the detected light began its journey. Comparing distant galaxy populations with nearer ones helps astronomers investigate changes across cosmic history.
An image alone does not label a galaxy with an exact age or distance. Researchers use additional measurements and models, often including redshift information, to interpret the view.
A deep field is therefore more like a sample containing objects from many distances than a single group photograph taken at one shared cosmic moment. That distinction prevents a visually crowded image from becoming a misleading timeline.
055. Compare wavelengths rather than expecting one perfect camera
Different wavelengths reveal different physical processes and structures. Hubble observes ultraviolet, visible, and near-infrared light, while Webb is designed mainly for infrared observations.
NASA explains how their capabilities complement rather than simply replace each other. Infrared observations can help investigate some dust-obscured regions and light from distant sources shifted toward longer wavelengths.
That does not mean infrared sees through every object or every dust cloud. Choose the wavelength for the scientific question, then interpret the image using the instrument’s sensitivity, resolution, and the physical conditions of the target.
066. Treat colour as an explained mapping
Many astronomical images combine separate observations through different filters. Visible colours may approximate aspects of human vision, emphasise selected emissions, or represent invisible wavelengths.
Assigning colours to data does not by itself make an image fictitious. The key question is what each colour represents.
Read the caption, filter information, and processing explanation before concluding that a blue region is literally what an unaided eye would see. Brightness stretching can reveal faint structure while changing the visual relationship between bright and dim features.
These choices are useful when disclosed, but appearance alone should not be mistaken for a calibrated temperature scale.
077. Revisit objects to measure change
A single exposure captures a state; a series can reveal a process. Repeated observations allow astronomers to measure brightness variations, changes in position, and evolving structures.
The observing interval must suit the question: some events need rapid follow-up, while stellar motions demand long baselines and precise reference measurements. Apparent change also needs verification.
Different filters, exposure depths, image scales, or processing choices can make an object look different without showing a physical transformation. Researchers compare compatible data and estimate uncertainties instead of treating every difference between two attractive published images as evidence that the universe changed in that way.
088. Map the Milky Way with repeated measurements
ESA’s Gaia work shows that astronomical imaging is not limited to dramatic nebula portraits. Its sky maps combine enormous numbers of measurements into a statistical view of our galaxy.
ESA’s Early Data Release 3 map displays the total brightness and colour of about 1.8 billion stars; its explanation identifies dense stellar regions and dark foreground clouds. Precise repeated position measurements also support astrometry, including the study of apparent motion and parallax.
A scientific map can therefore communicate large-scale structure while resting on individual measurements that carry much more information than the final illustration alone.
09Illustrative scenario: investigating a dark patch
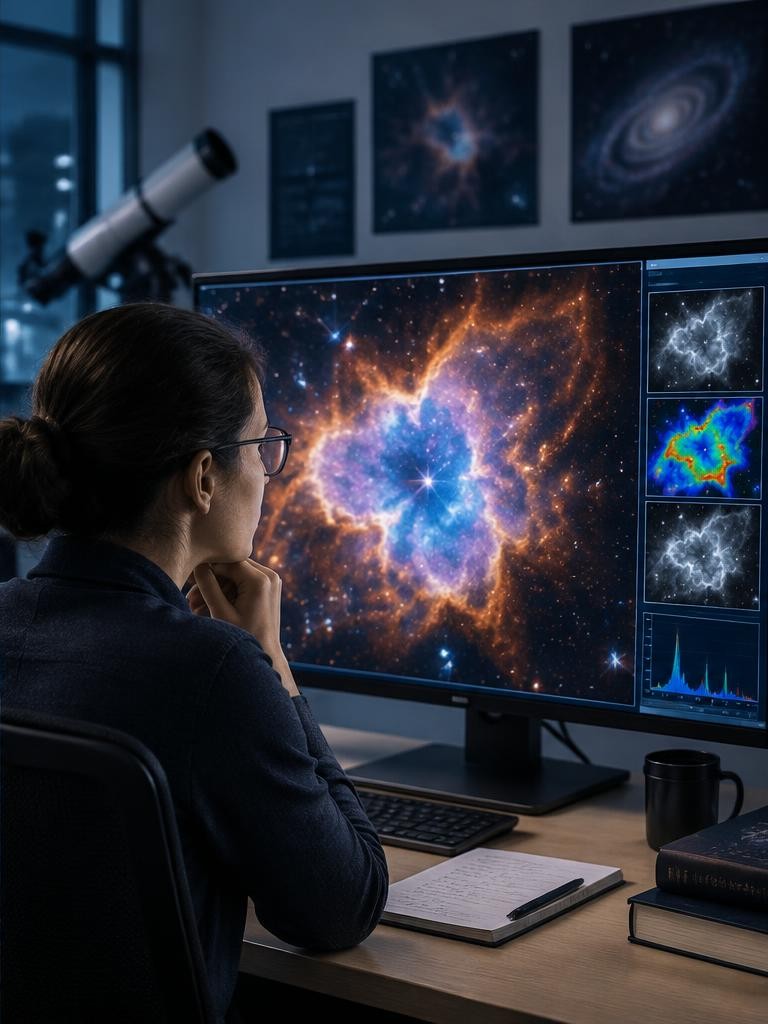
Imagine an astronomer comparing a visible-light image of a star-forming region with an infrared image of the same area. The visible view contains a dark lane; the infrared view shows additional sources nearby or within parts of it.
One hypothesis is that dust obscures some visible starlight while longer wavelengths reveal more of the region. The astronomer checks matching positions, resolution, sensitivity, and the actual filters before interpreting the difference.
They may then request spectra or other observations. This is an illustrative workflow, not a report of a particular discovery or proof that every dark feature is caused by dust.
Troubleshooting
10Mistakes and troubleshooting when reading space images
Do not infer physical size from apparent size without distance information. Do not confuse a long observing campaign with one uninterrupted exposure.
Do not assume every bright point is a star: some distant galaxies or image artefacts can look point-like at a given resolution. If an image seems inconsistent with another, compare orientation, field of view, wavelength, exposure depth, and processing before searching for a dramatic explanation.
When a caption calls something a candidate, preserve that uncertainty. A striking image can motivate a hypothesis, but confirmation may require spectroscopy, independent observations, and careful checks for instrumental or selection effects.
FAQ
11FAQ: real colour, black holes, and better telescopes
Are space images real? They are representations derived from observations; processing and colour mapping should be explained. Does a black-hole image show a solid surface? No; interpretation depends on the observing method and surrounding emission, so avoid treating all famous astronomy pictures as ordinary camera photographs. Is Webb simply a better Hubble? Their wavelength coverage and instruments differ, making comparison question-dependent. Can an image alone measure a galaxy’s distance? Sometimes imaging contributes to distance estimates, but many methods require calibration, assumptions, or additional data. Are all images taken in space? No; major astronomical imaging also comes from ground-based facilities.
Try this
12Exercise: read one image like a researcher
Choose an official NASA or ESA image with a detailed caption. Record the target, observatory, instrument if given, wavelength or filters, observing dates, field of view, and colour explanation.
Separate three things you can see from three things scientists infer. Then identify one uncertainty or missing measurement that would matter to your interpretation.
Compare a second wavelength view only after checking that it shows the same region. Use the Photography resources linked below to review exposure and light concepts.
The exercise builds a useful habit: admire the picture, then ask how the observation becomes evidence and where its limits remain.
Sources & further reading
These references support the technical explanations. Exercises and starting settings are illustrative and should be adapted to your equipment and conditions.
- Hubble vs. Webb — NASA Science
- Hubble’s Deep Fields — NASA Science
- Interactive map of the sky from Gaia’s Early Data Release 3 — ESA
Free resources from LensSuite
Was this guide helpful?