

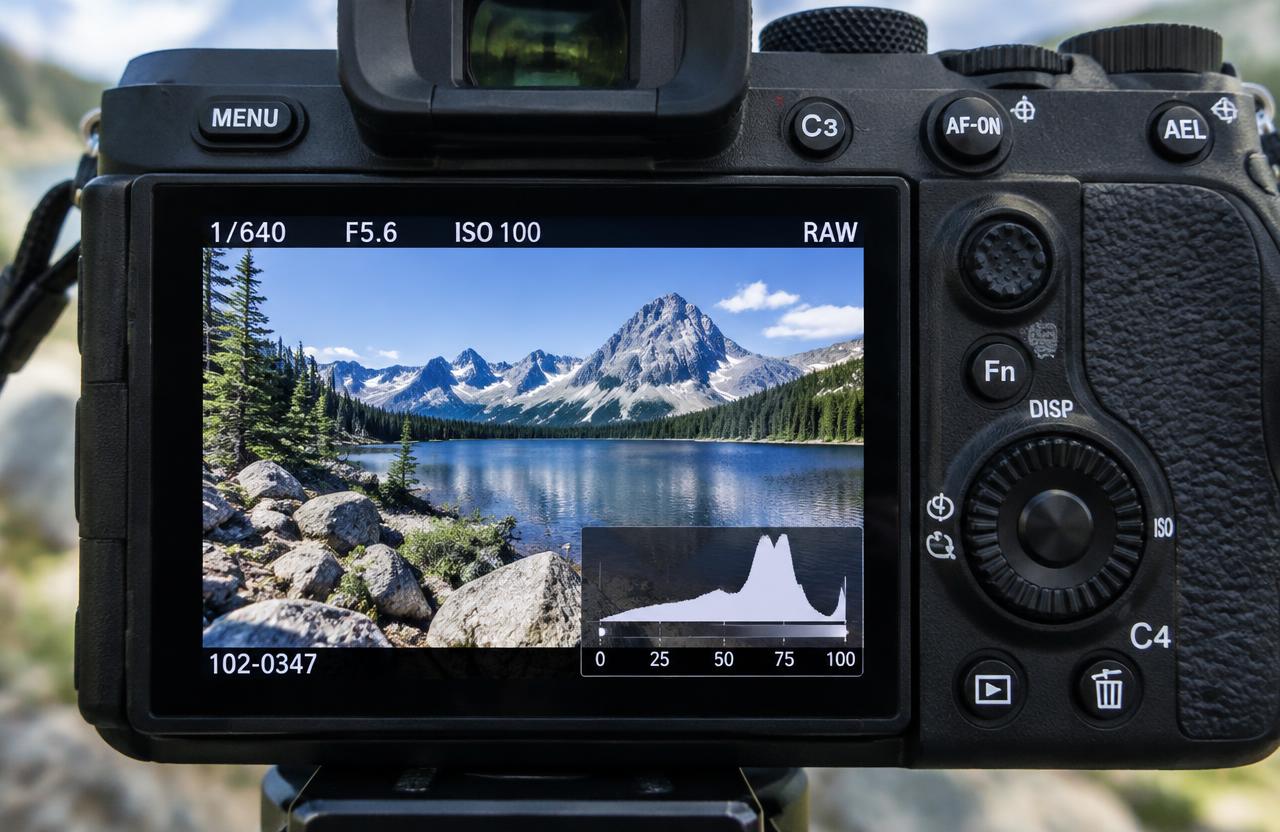
A histogram shows how an image’s pixels are distributed across brightness values or individual color-channel values. Dark tones sit toward the left, bright tones toward the right, and intermediate tones between them. Taller areas indicate that more pixels fall within those values. Nikon’s camera-histogram guide explains this left-to-right arrangement. The graph helps you assess exposure and tonal distribution, but it cannot decide whether your photograph succeeds. A dark concert scene and a bright snowy landscape should not be expected to produce the same graph.
01Read the horizontal and vertical axes correctly
The horizontal axis describes tone, not position in the photograph. Pixels from the left edge of your composition can appear anywhere along the histogram depending on their brightness.
The vertical axis describes how many pixels occupy a tonal interval, not how bright those pixels are.
A tall central peak therefore means many pixels have similar intermediate values. It does not necessarily mean the subject is centered or correctly exposed.
Some displays rescale the graph vertically, so compare its overall distribution and endpoints rather than treating peak height as a fixed measurement across different photographs.
02Understand the familiar zero-to-255 scale
An eight-bit representation uses 256 values per channel, conventionally numbered zero through 255. Zero represents the minimum and 255 the maximum in that representation.
Nikon uses this familiar scale when explaining camera histograms.
That does not mean your raw file contains only eight-bit data or that every editing histogram uses those exact displayed numbers. Raw capture, processing spaces, and display representations are different stages.
Use the scale to understand endpoints, but do not mistake the camera’s graph for a complete numerical report of every value originally recorded by the sensor.
03Left-heavy and right-heavy can both be correct
A photograph containing black clothing, a dark background, and small illuminated faces will naturally place many pixels toward the left. A pale studio background and light clothing will push more of the distribution toward the right.
Judge the graph against the scene and your intention. Ask whether important dark details remain distinguishable and whether bright textured areas retain information.
Do not add exposure simply to center a night photograph, or darken a high-key image just to create a symmetrical mound. The subject’s tonal character matters more than an imagined ideal shape.
04Recognize clipping without panicking at every edge
Clipping occurs when values reach an endpoint and tonal distinctions are lost in that representation. A pile-up at the right edge can warn of clipped highlights; the left edge can warn of clipped shadows.
Adobe’s Camera Raw tonal-adjustment documentation explains both warnings.
However, a graph touching an edge does not reveal which objects are involved or whether the loss matters. A small reflection from chrome may reasonably reach white.
A wedding dress with missing fabric detail may be a serious problem. Locate the affected area before deciding whether to change exposure.
05Check RGB channels for color problems
A combined brightness graph can hide trouble in an individual color channel. Strongly colored subjects or colored stage lighting may push one channel to its limit even when overall brightness appears acceptable.
Inspect the red, green, and blue histograms when the camera provides them.
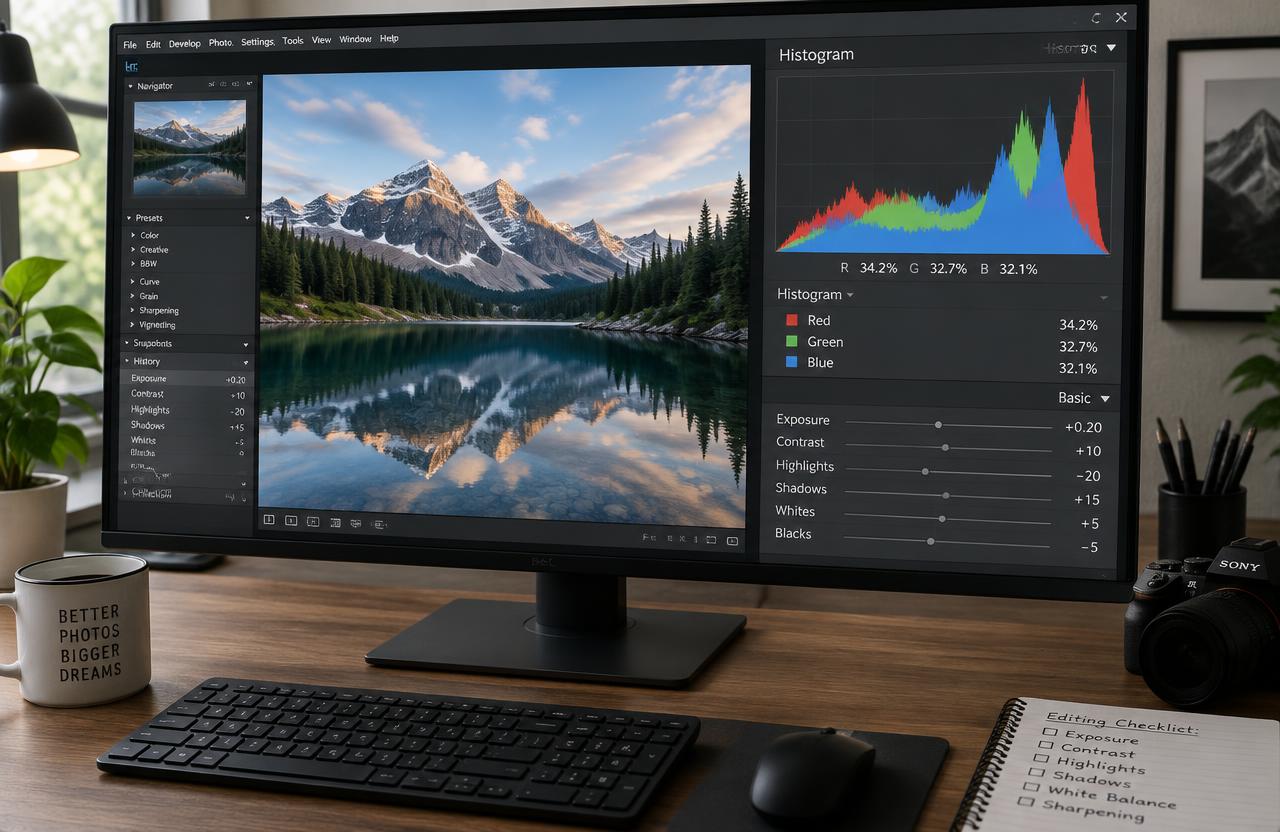
Adobe’s Camera Raw documentation describes its colored histogram ribbons and their overlap. If a saturated red flower loses subtle petal variation, examine the red channel rather than only darkening the entire image blindly.
Color-channel clipping can affect hue and texture, so evaluate the photograph as well as the warning.
06Use a repeatable on-location sequence
First, choose aperture and shutter speed for depth of field and motion. Select an appropriate ISO, make a test frame, and open the histogram display.
Identify the scene’s important highlights, then check the graph and any highlight warnings.
If important bright detail appears clipped, reduce exposure and test again. If the image is unnecessarily dark with ample highlight room, consider increasing exposure within your motion and depth-of-field constraints.
Finally, zoom into the subject to inspect sharpness and detail. A histogram does not reveal missed focus, camera shake, or an awkward expression.
07A worked one-stop correction
Suppose a hypothetical sunlit scene is photographed at ISO 100, f/8, and 1/250 second. Highlight warnings cover a pale textured wall that needs detail.
Changing to 1/500 second reduces exposure by one stop, halving the exposure time while keeping aperture and ISO fixed.
Review the new frame rather than assuming the correction is sufficient. The histogram’s shape will not necessarily slide rigidly by a predictable number of graph columns because displayed tone processing is nonlinear.
If the wall now retains texture, compare shadow detail and choose the best compromise for the actual subject.
08Know the limits of camera previews
Many cameras derive their playback histogram from a processed preview, even when recording raw files. White balance, picture styles, and contrast settings can therefore affect the displayed result.
Consult your camera manual for its implementation rather than assuming every histogram directly measures raw sensor clipping.
Adobe’s introduction to Camera Raw explains that raw data must be interpreted into a color image and can be reprocessed. A preview warning may not map perfectly to recoverable raw detail.
Nevertheless, do not rely on unspecified recovery headroom when important highlights are at risk.
09An illustrative snow-scene decision
Imagine a hypothetical photographer making a portrait against snow. The camera meter initially produces gray-looking snow and a histogram concentrated near the middle.
Increasing exposure moves the pale scene toward the right, which is appropriate because much of the composition is genuinely bright.
The photographer stops increasing exposure when important snow texture and the subject’s face are preserved, not when the graph fills every column. A tiny sun reflection still blinks, but the textured areas remain intact.
This fictional example shows why scene interpretation is more useful than a rule demanding either centered tones or absolutely no clipping.
10Read the editing histogram as a changing interpretation
In Lightroom or Camera Raw, the histogram updates as you change processing controls. Start with overall brightness, then refine highlights, shadows, and tonal endpoints.
Use clipping previews to identify affected areas, as Adobe recommends in its Camera Raw guidance.
Reducing Highlights may reveal information that the current rendering conceals, but it cannot guarantee recovery of detail absent from the capture. Likewise, raising Shadows can reveal noise along with useful information.
Inspect the picture at normal viewing size and at a closer scale. The objective is a convincing photograph, not merely a tidy distribution.
Troubleshooting
11Troubleshoot misleading graphs
If the histogram changes while you zoom during playback, check the camera’s behavior. Nikon notes that some models can display a histogram for the magnified area rather than the whole frame.
That can be useful, but confusing if you assume the scope remains unchanged.
If the graph looks safe but skin or flowers lose color, inspect RGB channels. If the screen looks bright but the graph is dark, review screen brightness and ambient viewing conditions.
If highlights and shadows both clip, the scene may exceed the capture’s useful range; change the light, composition, or capture strategy.
FAQ
12Common questions and a practical decision rule
Should every histogram stretch from edge to edge? No. Low-contrast fog and restrained high-key images can legitimately occupy a narrower range. Is a central peak desirable? Only if it reflects the subject and intended rendering. Can the histogram show where clipping occurs? Not by itself; combine it with image inspection and clipping warnings.
Use this decision rule: preserve the details that matter, accept deliberate tonal choices, and check the result against the scene. Practice by photographing one pale subject and one dark subject, then explain why their correct exposures produce different graphs.
Sources & further reading
These references support the technical explanations. Exercises and starting settings are illustrative and should be adapted to your equipment and conditions.
- Nikon: Learning How to Use Your Camera’s Histogram
- Adobe: Make color and tonal adjustments in Camera Raw
- Adobe: Introduction to Camera Raw
Free resources from LensSuite
Was this guide helpful?